
Introduction to It
First, you can watch the short video that introduces basic use:
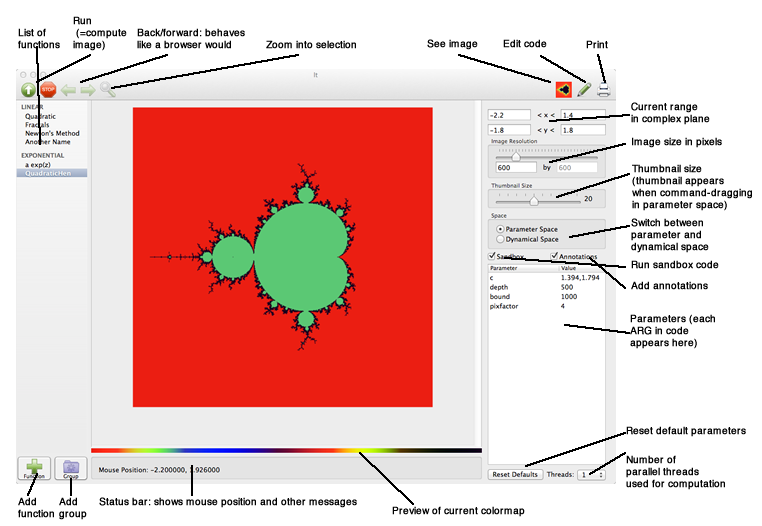
The User Interface
Writing Your Own Functions
While It comes with a number of built-in functions, the real reason to use It is to create your own. Functions are written in the C++ languageand are compiled on-the-fly by the It application. It is not necessary to have any development tools installed on your machine. C++ has a reputation of being a large and complex language. However, writing functions for It does not require any of the more esoteric features of C++, which is why a basic command of basic C and a ability to learn by example should be sufficient.
Creating a new function for It, in a technical sense, means creating a subclass of the C++ class called Function. From a practical point of view, creating a new function means choosing "New Function" from the File menu. This will present you with template code: that is, code that works as is (the quadratic function, i.e. the well-known Mandelbrot set). Your job will then be consist of the following steps:
- Declare your working variables
- Add/modify parameters.
- Implement the iterate function, which assigns a color to a given point in your image.
- Implement the orbit function, which tells the program how to iterate one step forward.
- Implement the setParameter function, which is used to switch from parameter space to dynamical space.
Optionally, you can also:
- Implement the sandbox function, which lets you manipulate the pixels of the image directly
- Implement he annotate function, which lets you add graphical annotation on top of the image.
Variables Available to Functions
Since a function is a subclass of Function, you are given a number of variables that help you write your function. These variables are all uppercase (since they are really macros).
| Variable | Type | Meaning |
| PARAMETER_SPACE | bool | True when in parameter space |
DYNAMICAL_SPACE |
bool | True when in dynamical space |
| XMIN | double | Range: minimal x-value (real coordinates) |
| XMAX | double | Range: maximal x-value |
| YMIN | double | Range: minimal y-value |
| YMAX | double | Range: maximal y-value |
| XRES | double | Image width in pixels |
| YRES | double | image height in pixels |
Declaring Variables and Parameters
You can declare working variables as you see fit at the beginning of the class declaration:
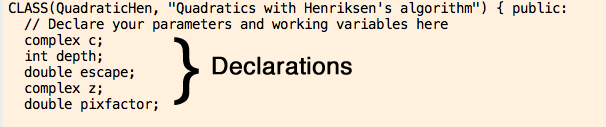
Every parameter must also be declared as a working variable. In order to turn a variable into a parameter (which shows up in the user interface), you have to use the PARAM declaration in the constructor (the constructor in a C++ class is a special function that is called when the object is first created. The constructor has the same name as the class.
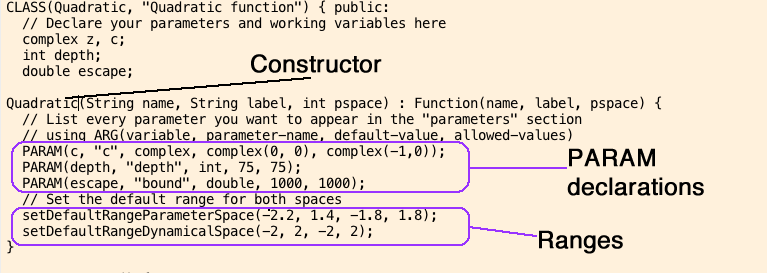
An PARAM declaration has the following form:
PARAM(variable, name, type, default-value-parameters-space, default-value-dynamical-space) where:
- variable is the variable you have declared
- name is a string you want to show up in the user interface
- default-value-parameter-space is the default value when in parameter space
- default-value-dynamical-space is the default value in dynamical space
In addition, you have to provide the default image range for both spaces, in the following way:
setDefaultRangeParameterSpace(xmin, xmax, ymin, ymax);
setDefaultRangeDynamicalSpace(xmin, xmax, ymin, ymax);
copy
Writing a copy function is optional, but necessary if you want to speed up calculation by using multiple cores. A copy function is written as follows (and included in the Template class):
Function *copy() {
 Template *f = new Template(name, "", pspace);
 return f->copyArgsFrom(this);
}
iterate
iterate is the most important function. When an image is computed, iterate is called for every pixel. Its two arguments (double x, double y) represent the coordinates of the pixel.
iterate must return a number between 0 and 255. This number is used as an index into the current colormap. You can see a preview of the colormap below the image region: 0 would be the leftmost color, and 255 would be the rightmost color:
![]()
How your function computes this number is entirely up to you. The example from the quadratic function shows how you can do two different things depending on whether you are in parameter or dynamical space:
byte iterate(double x, double y) {
 int i;
 if (PARAMETER_SPACE) {
   z = complex(0, 0);
   c.set(x, y);
 } else {
   z = complex(x, y);
 }
 for (i = 0; i < depth; i++) {
   z = z * z + c;
   if (norm(z) > escape * escape) break;
 }
 return (byte)(255*i/depth);
}
orbit
orbit represents a single pass through the function, or in a way, the "function" itself. You are passed a complex number, to which you should apply your function (i.e. modify it in-place). The example from the quadratic function:
void orbit(complex &x) {
  x =  x * x + c;
}
setParameter
setParameter allows the program to switch from parameter space to dynamical space. As you command-move the mouse in parameter space, you can see a preview of the corresponding image in dynamical space. This is accomplished by calling setParameter. What setParameter actually does is up to you, but you should store the x/y value in a variable to use it dynamical space. In the quadratic function example, the parameter is called c (see the iterate example), and setParameter is implemented as follows:
void setParameter(double x, double y) {
 c.set(x, y);
}
sandbox
sandbox is a function that is called after the image is created. It is meant as a way to experiment with alternative algorithms, or to manipulate the image. sandbox will typically use the macros SETPIXEL and GETPIXEL. There are two versions: SETPIXEL and SETPIXEL_. The former uses real coordinates (of the complex plane), whereas the latter uses image coordinates.
The macros you can use in this context are:
- SETPIXEL(x, y, color) -- set a pixel corresponding to real coordinates x, y
- SETPIXEL_(x, y, color) -- set a pixel in image coordinates (0, 0) is lower left
- GETPIXEL(x, y) -- returns the pixel value at real coordinates x,y
- GETPIXEL_(x, y) -- returns the pixel value at image coordinates x, y
- HLINE(x, y, dx, col) -- draw a line from point x, y to x+dx, y
- VLINE(x, y, dy, col) -- draw a line from x, y to x, y+dy
- HLINE_(x, y, dx, col) -- draw a line from point x, y to x+dx, y (image coordinates)
- VLINE_(x, y, dy, col) -- draw a line from x, y to x, y+dy (image coordinates)
annotate
annotate allows you to add vector graphics to your image. For example, you can draw lines, rectangles, ellipses/circles, as well as text. For example, in order to ..., you could write:
void annotate() {
 // Draw a yellow 2x2 rectangle at -1,-1
 // Notice colors are given as red, green, blue, opacity where each ranges from 0..1
 SetFillColor(1, 1, 0, 1);
 FillRect(-1, -1, 2, 2);
 // Draw a red rectangle 300 by 300 pixels at bottom-left corner of image
 SetFillColor(1, 0, 0, 0.5);
 FillRect(0, 0, 300, 300, false);
 // Draw the text "foo" in white, using the Arial font
 SetFillColor(1,1,1,1);
 SetFont("Arial", 1);
 DrawText("foo", 1,1);
 // Draw a blue line from -1,-1 to 1,1
 SetStrokeColor(0, 0, 1, 1);
 SetLineWidth(1);
 DrawLine(-1, -1, 1, 1);
}
Notice that many of the function have an optional argument realcoords, which if you omit it defaults to true. By setting realcoords to false, you can use image coordinates instead of real coordinates.
The following functions are available in this context:
- void SetStrokeColor(double r, double g, double b, double opa);
- void SetFillColor(double r, double g, double b, double opa);
- void SetLineWidth(double w);
- void DrawLine(double x0, double y0, double x1, double y1, bool realcoords = true);
- void DrawRect(double x, double y, double w, double h, bool realcoords = true);
- void FillRect(double x, double y, double w, double h, bool realcoords = true);
- void DrawEllipseInRect(double x, double y, double w, double h, bool realcoords = true);
- void FillEllipseInRect(double x, double y, double w, double h, bool realcoords = true);
- void SetFont(const char *name, double size);
- void DrawText(const char *txt, double x, double y, bool realcoords = true);
Color Maps and Working with Colors
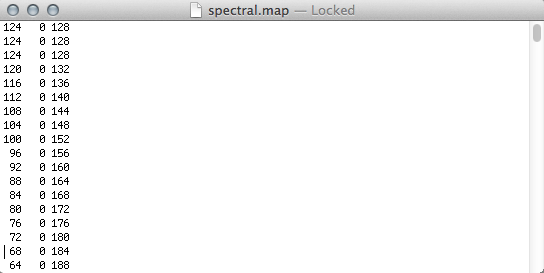
Color maps map a number from 0 to 255 to a color. The number from 0 to 255 is called the index into the color map. It comes with a number of color maps. Each map is defined in a text file, which contains 255 lines, each with a list of three numbers also between 0 and 255 separated by whitespaec. Each line defines a color using RGB encoding: intensities of red, green, and blue. For example, 0,0,0 represents black, 255,0,0 would be pure red, 255,255,0 is yellow, and 255,255,255 is white. A colormap file looks like this:
Color maps are installed in the director ~/Library/Application Support/It/Maps. Important: the OS X Finder will not show you this directory. In Finder, you have to use Go > Go to Folder, and type in "~/Library/Application Support/It/Maps".
If you add another file in that directory (in the correct format), it will be used (you need to restart It to take effect).
However, if you simply want to use specific colors, you can use a simpler technique. You can inject colors into the current colormap by using the SETCOLOR(index, red, green, blue) call in the setColors function. For example, if you add the following method to your class, index 0 (the number you return from iterate) will correspond to red, and index 1 will be black, irrespective of the colormap choice.
void setColors() {
  SETCOLOR(0, 255, 0, 0);
  SETCOLOR(1, 0, 0, 0);
}
Notice that using setColors does not modify the current colormap file permanently.
Rays, Equipotentials and Sectors for Quadratic Maps
There are functions which allow you to draw rays, equipotential curves and sectors for the quadratic family.
This functions can be used from the sandbox function only.
You can find an example in the sample function Quadratic+rays.
The functions are:
1) Draw an equipotential curve of a given potential from the ray p/q to the ray theta with a certain escape bound:
equipotential(c value, potential value, p, q , theta, escape)
-- The c value is ignored if you are in parameter space.
-- The values can be arguments taken from the interface, but also can be numbers. Example:
equipotential(state, c, 0.25, 0, 1 , 1, 500)
will draw a full equipotential of potential 0.25, for the current c-value.
2) Draw an external ray of argument p/q, from 0 to a certain equipotential level, with resolution npoints and a certain escape bound, iterating depth times.
rational_rays(c, depth, p, q, startingpot, escape, npoints);
3) Draw a sector around the ray of argument p/q, with a given slope, and until a certain equipotential. Given escape bound, number of iterations (depth) and resolution (points).
draw_sect(c, p, q, slope, startingpotential, escaperadius, depth, npoints)
Example: draw_sect(c, 1,7,0.1,0.25,1000,75,40000)